Quality Advisor
A free online reference for statistical process control, process capability analysis, measurement systems analysis,
control chart interpretation, and other quality metrics.

SPC DEMO
Minimize Production Costs, Quickly Detect Issues, and Optimize Your Product Quality
Don’t miss out! Book a demo of our specialized SPC software and unlock immediate improvements in your processes.
Histogram: Compare to normal distribution
Is the shape of the histogram normal? The following characteristics of normal distributions will help in studying your histogram, which you can create using software like SQCpack.
- The first characteristic of the normal distribution is that the mean (average), median, and mode are equal.
- A second characteristic of the normal distribution is that it is symmetrical. This means that if the distribution is cut in half, each side would be the mirror of the other. It also must form a bell-shaped curve to be normal. A bimodal or uniform distribution may be symmetrical; however, these do not represent normal distributions.
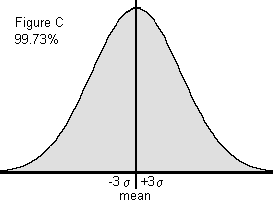
- A third characteristic of the normal distribution is that the total area under the curve is equal to one. The total area, however, is not shown. This is because the tails extend to infinity. Standard practice is to show 99.73% of the area, which is plus and minus 3 standard deviations from the average.
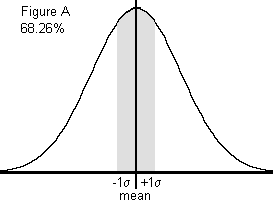
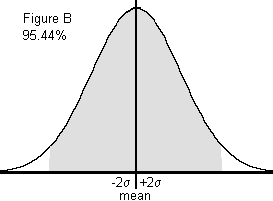
- The fourth characteristic of the normal distribution is that the area under the curve can be determined. If the spread of the data (described by its standard deviation) is known, one can determine the percentage of data under sections of the curve. To illustrate, refer to the sketches right. For Figure A, 1 times the standard deviation to the right and 1 times the standard deviation to the left of the mean (the center of the curve) captures 68.26% of the area under the curve. For Figure B, 2 times the standard deviation on either side of the mean captures 95.44% of the area under the curve. Consequently, for Figure C, 3 times the standard deviation on either side of the mean captures 99.73% of the area under the curve. These percentages are true for all data that falls into a normally distributed pattern. These percentages are found in the standard normal distribution table.
- Once the mean and the standard deviation of the data are known, the area under the curve can be described. For instance 3 times the standard deviation on either side of the mean captures 99.73% of the data.


Follow these steps to interpret histograms.
- Study the shape.
- Calculate descriptive statistics.
- Compare the histogram to the normal distribution.