Quality Advisor
A free online reference for statistical process control, process capability analysis, measurement systems analysis,
control chart interpretation, and other quality metrics.

SPC DEMO
Don’t miss out! Book a demo of our specialized SPC software and unlock immediate improvements in your processes.
6.3. Interpret Cp and Cpk
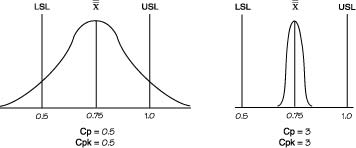
The Cp and Cpk indices are the primary capability indices. Cp shows whether the distribution can potentially fit inside the specification, while Cpk shows whether the overall average is centrally located. If the overall average is in the center of the specification, the Cp and Cpk values will be the same. If the Cp and Cpk values are different, the overall average is not centrally located. The larger the difference in the values, the more offset the overall average. This concept is shown graphically below.
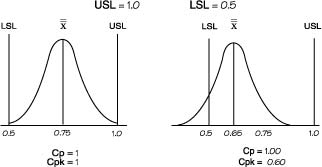
Cpk can never exceed Cp, so Cp can be seen as the potential Cpk if the overall average is centrally set. In the example, Cp is 1.17 and Cpk is 0.67. This shows that the distribution can potentially fit within the specification. However, the overall average is currently off center. The Cpk value does not state whether the overall average is offset on the upper or lower side. It is necessary to go to the Z values to discern this. An alternative is to show the capability indices Cpu and Cpl.
The above article is an excerpt from the “Operational definition” chapter of Practical Tools for Continuous Improvement Volume 2 Statistical Tools.