Quality Advisor
A free online reference for statistical process control, process capability analysis, measurement systems analysis,
control chart interpretation, and other quality metrics.

SPC DEMO
Don’t miss out! Book a demo of our specialized SPC software and unlock immediate improvements in your processes.
c-chart
What is it?
A c-chart is an attributes control chart used with data collected in subgroups that are the same size. C-charts show how the process, measured by the number of nonconformities per item or group of items, changes over time. Nonconformities are defects or occurrences found in the sampled subgroup. They can be described as any characteristic that is present but should not be, or any characteristic that is not present but should be. For example a scratch, dent, bubble, blemish, missing button, and a tear would all be nonconformities. C-charts are used to determine if the process is stable and predictable, as well as to monitor the effects of process improvement theories. C-charts can be created using software products like SQCpack.
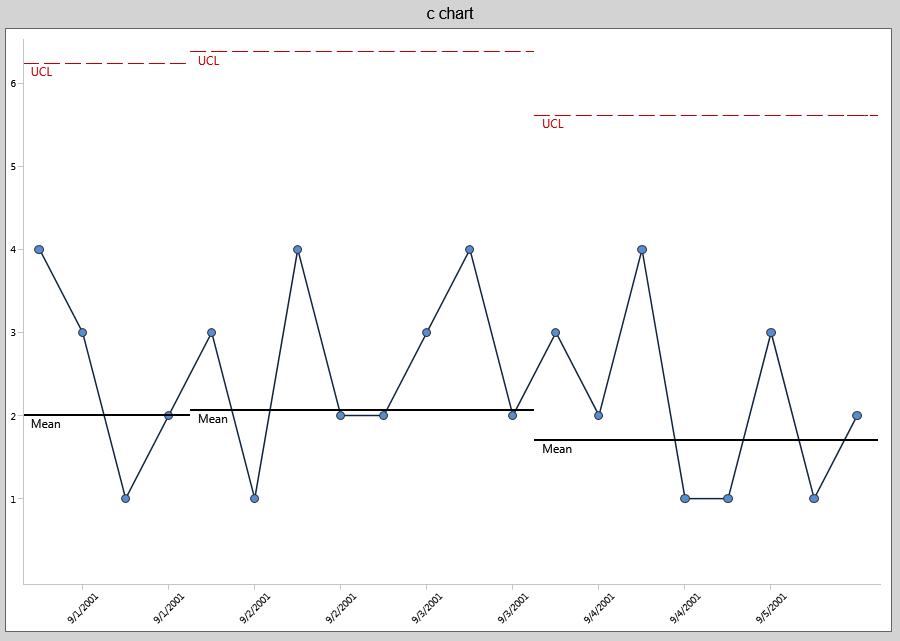
What does it look like?
The c-chart shows the number of nonconformities in subgroups of equal size.