PQ Systems: SPC and Gage Management Software for Manufacturers
For decades, PQ Systems has delivered reliable statistical quality and production control tools to help manufacturers ensure quality and compliance.
- SQCpack provides a robust SPC solution to improve processes and drive consistent results
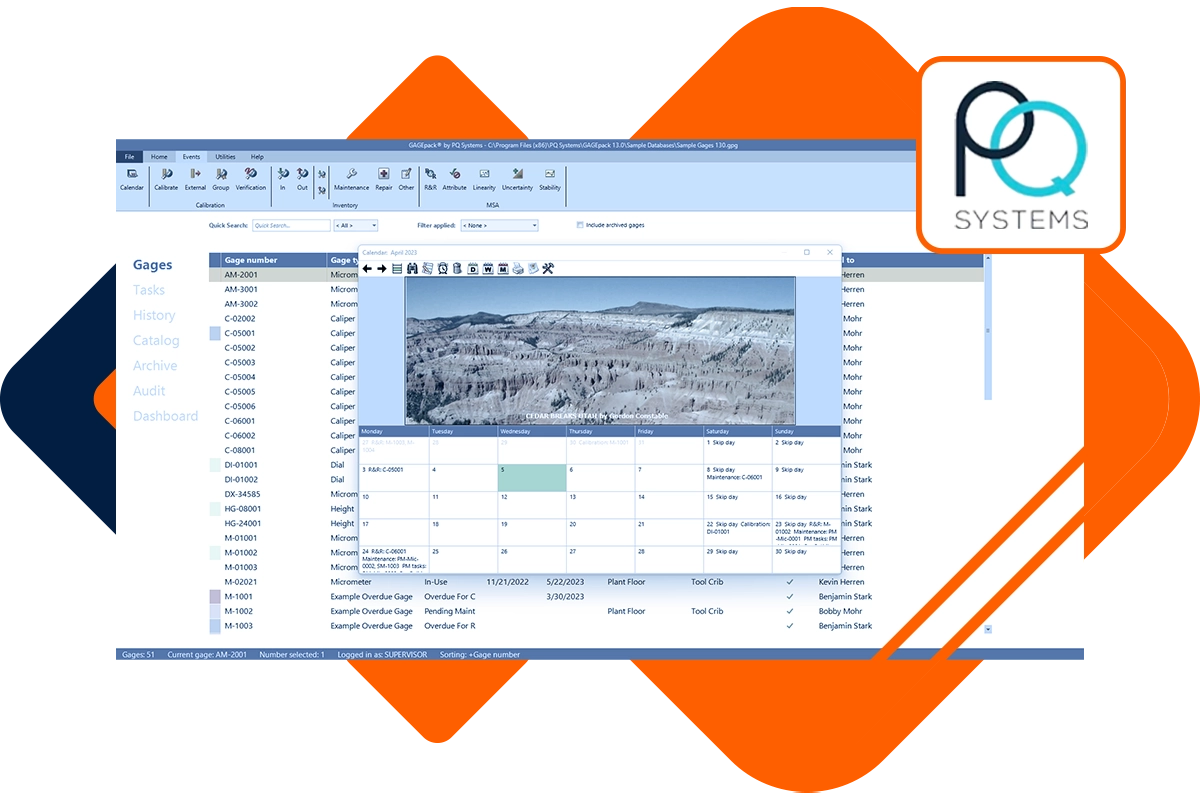
- GAGEpack streamlines gage management for optimal measurement accuracy
PQSystems SPC and Gage Management solutions empower you to maintain high standards and achieve operational excellence.


Interactive Guide
A free online reference for statistical process control ,process capability analysis, measurement systems analysis, control chart
New Customers
Existing Customers
World-Class SPC and Gage Management Solutions Focused on Quality Improvement
PQ Systems provides intuitive solutions to help manufacturers optimize process performance, improve product quality, and mitigate supply chain risk. Simple and intuitive, yet accurate and complete, our solutions will help you achieve quality improvement success. PQ Systems SPC and gage management quality improvement solutions are relied on across an array of industries, ranging from aerospace to healthcare.
Harness the power of data analysis to increase customer satisfaction, improve audit success, and meet quality compliance requirements with statistical process control (SPC) software. PQ Systems delivers a robust SPC application that will help you easily analyze your data, understand and improve your processes, and communicate important quality information. Whether it’s for use on a single line or in a global multi-site operation, we provide a scalable, easy-to-use software solution to help you optimize quality that is simple to deploy, implement, and operate. Features include:
- SPC Charts: Get to the discovery phase of your processes faster and reveal what your data is telling you. Analyze mass amounts of data easily, utilizing the software’s SPC charting tools. This allows users to cut through the noise and get to the information that you need.
- Process Alerts: Prevent quality control issues with immediate process feedback.
- Capability Analysis: Improve your quality performance by using capability analysis to assess whether your process is statistically capable of meeting specifications or requirements. Ensure processes are on target with minimal variation with a selection of capability analysis calculations.
- Industry Compliance: Comply with industry standards including, ISO9000 & ISO9001, ISO/IATF 16949, AS9100, FDA CFR 21 part 11, and others. Maintain an audit trail with a robust and precise record of changes to your data in order to maintain a historic record. Respond to audit requests with ease and spend less time searching for SPC data with powerful filtering tools.
- Data Collection: Manually enter measurements, import data from a variety of sources like SQL and Excel, or input data directly from equipment such as CMMs and handheld measurement devices.
- Reporting: Use a report template or create your own to easily share SPC charts, process capability and process performance statistics, Certificates of Analysis, and more.
Blog
Learn how Honeybee Robotics uses PQ Systems to support its gage management system and comply with ISO and AS auditors.

What to Expect
- Free 20-minute call with a product expert
- Live demo tailored to your industry requirements
- Discover what products best fit your needs
- No games, gimmicks, or high-pressure sales pitch


