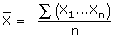
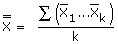
X-bar control limits are based on either range or sigma, depending on which chart it is paired with. When the X-bar chart is paired with a sigma chart, the most common (and recommended) method of computing control limits based on 3 standard deviations is:
n is the number of observations
k is the number of subgroups
Upper control limit
Lower control limit